Lesson 23 — AI/ML platform: GPU observability — DCGM, NCCL tests, roofline capacity planning
2026-10-01
What interviewers are really probing
Lesson 18 gave you SKU pools. Lesson 19 made NVLink / RDMA / NCCL schedulable. Lesson 20 admitted gangs without half-placing them. Lesson 21 made KV cache the capacity wallet and taught TTFT / TPOT / goodput. Lesson 22 split prefill vs decode and placed MoE EP on the fabric. This lesson is the eyes and measuring stick: how do you know a GPU is sick, a rail is lying, or a cell is off the roof — and how do you turn that into cordon/drain, canaries, and capacity plans without opening a security hole on every scrape path?
Interviewers at hyperscale AI platforms (fuel: wafer-ai/gpu-perf-engineering-resources (opens in a new tab)) want evidence you have operated GPU observability under fleet failure, not only “we installed dcgm-exporter”:
- DCGM / dcgm-exporter — field groups, XID / NVML, SM / HBM / power / clocks / ECC / NVLink / temp / throttle; DaemonSet + Prometheus; join to node / GPU UUID / MIG UUID
- Health / remediation loops — XID 79/48/etc → cordon + drain; soft reset vs RMA; MIG partition health
- NCCL tests as fleet canaries —
all_reduce_perf; BusBw vs AlgBw; when to run (join, NIC flap, nightly); topology baselines from L19 - Roofline / capacity planning — arithmetic intensity; HBM BW vs FLOPs roofs (H100/H200-class); map prefill (compute) vs decode (mem-BW) from L21/L22; cell capacity = min(FLOPs, HBM BW, NVLink/RDMA, KV seats)
- Stitched stack — DCGM (silicon) + NCCL canaries (fabric) + app SLOs (TTFT/TPOT) + PD/MoE transfer metrics
- Security floor — who scrapes metrics; no PII / model IDs in labels; NCCL test privilege; signed images; NetPol / RBAC; no train SA on obs pods; RO weights still apply beside serve
Interview sentence: “I run dcgm-exporter on every GPU node with UUID joins into Prometheus, page on XID and throttle into cordon/drain with soft-reset vs RMA policy, keep NCCL all_reduce_perf canaries as fabric baselines per topology, place prefill and decode on the roofline with DCGM + load tests, and size each cell as min(FLOPs, HBM BW, fabric, KV seats) — with NetPol, signed DCGM images, and zero train SA on obs or canary pods.”
Core diagram: GPU → DCGM → Prometheus → ops (+ NCCL canary, roofline, security floor)
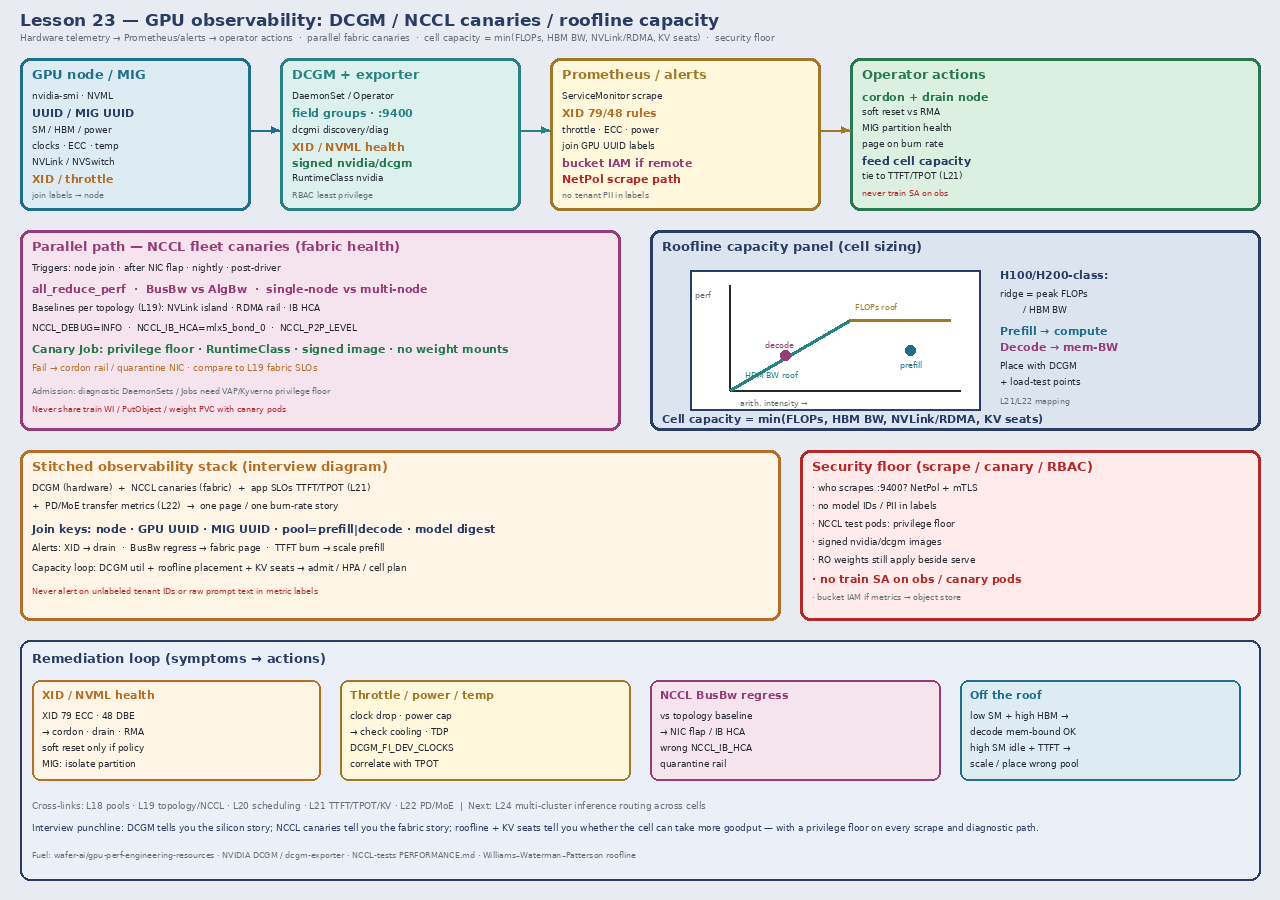
Read it left-to-right, then the parallel paths: Every GPU node exposes silicon state through DCGM (embedded or host-engine) and dcgm-exporter on :9400. Prometheus scrapes with GPU UUID / MIG UUID / node joins. Alerts drive cordon + drain, soft reset vs RMA, and capacity updates. In parallel, NCCL canaries (all_reduce_perf) validate fabric BusBw against L19 baselines. A roofline panel places prefill vs decode and caps cell admit as min(FLOPs, HBM BW, NVLink/RDMA, KV seats). Everything sits on a security floor: NetPol on scrape, signed nvidia/dcgm images, privilege floor on diagnostic Jobs, no train SA, no tenant PII in metric labels.
Idiosyncrasies / operator depth
1. DCGM vs nvidia-smi vs NVML — what each is for
| Tool | Operator use | Gotcha |
|---|---|---|
| nvidia-smi | Human snapshot; quick “is it on fire?” | Not a scrape API; don’t SSH-loop it as monitoring |
| NVML | Library under smi / many agents | Process-local; not fleet health by itself |
| DCGM | Cluster GPU manager: groups, health, diagnostics, policies | Needs consistent driver / DCGM version story |
| dcgm-exporter | Prometheus exposition of DCGM fields | Field groups matter; profiling metrics cost cycles on older arches |
2. Field groups that interviewers expect you to name
| Domain | Example fields / signals | Why you page |
|---|---|---|
| Utilization | SM util, memory util, tensor/FP activity (profiling) | Idle GPUs with pending work = scheduler/placement bug |
| Memory | HBM used/free, ECC SEBE/DBE | Decode capacity + silent data corruption risk |
| Clocks / power | SM/mem clocks, power draw, power limit | Unexpected throttle → TPOT / train step-time |
| Thermals | GPU temp, slowdown / thermal throttle flags | Cooling / rack issue masquerading as “model regressed” |
| Interconnect | NVLink / NVSwitch throughput & errors | MoE EP and TP collectives (L19, L22) |
| Health | XID counters, NVML events, retired pages | Hardware / driver faults → drain before customer SLOs die |
| Identity | GPU UUID, MIG UUID, device index | Join key for multi-tenant cells; never confuse indices across reboots |
3. Joining metrics — the fleet hygiene most people skip
| Join key | Use |
|---|---|
Hostname / K8s node | Map exporter → node; cordon target |
UUID (GPU) | Stable across container restarts; preferred over index |
GPU_I_ID / MIG UUID | MIG partition health (L18) |
pod / namespace (exporter Kubernetes mode) | Attribute util to workload — carefully (cardinality!) |
pool=prefill|decode|train | Capacity and SLO burn by pool (L20–L22) |
Gotcha: High-cardinality labels (request IDs, user IDs, raw model names per tenant) will melt Prometheus and leak identity. Keep pool + digest short-hash + UUID; put tenant detail in logs/traces with access control — not in DCGM labels.
4. XID / health remediation — operator playbook
| Signal | Typical meaning | First response |
|---|---|---|
| XID 79 (GPU fallen off bus / ECC storm class — confirm against current NVIDIA XID table) | Serious HW / ECC path | Cordon → drain → quarantine; open RMA path |
| XID 48 / DBE class | Double-bit ECC | Drain; do not keep serving on that GPU |
| XID 13 / 31 / 43 (illegal / MMU / etc — confirm live docs) | Often app/driver; sometimes HW | Correlate with workload + driver version; isolate MIG if partitioned |
| NVML health fails | Device plugin / GPU Operator marks unhealthy | Trust the unhealthy taint; don’t force-schedule |
| Thermal / power throttle | Cooling or power-cap | Fix rack/power policy before blaming the model |
| MIG instance unhealthy | One partition, not whole GPU | Quarantine MIG UUID; keep sibling instances only if policy allows |
Soft reset vs RMA: Soft reset / node recycle is for transient driver/app faults after root-cause. Recurring XID on the same UUID after reset → RMA / host replace, not “reboot until green.” Interviewers listen for that distinction.
5. NCCL tests as fleet canaries (not a one-off bench)
| Practice | Operator meaning |
|---|---|
| When | Node join / reclaim; after NIC flap or driver upgrade; nightly fabric sweep; before admitting a new topology SKU |
| What | all_reduce_perf (plus all_gather / reduce_scatter when EP-heavy) |
| BusBw vs AlgBw | BusBw ≈ hardware-comparable (corrected); AlgBw = app-visible; compare BusBw to NVLink/IB peak × efficiency |
| Single-node | Validates NVLink / P2P island |
| Multi-node | Validates RDMA path + NCCL_IB_HCA selection (L19) |
| Baseline | Per SKU × topology class; alert on regression %, not absolute magic numbers |
| Privilege | Canary Job needs GPUs + often IB devices — privilege floor (below), never train WI |
6. Roofline for platform engineers (not CUDA kernel authors)
| Idea | Platform translation |
|---|---|
| Arithmetic intensity | FLOPs / bytes moved from HBM (approx.) |
| Memory roof | Performance ≤ HBM bandwidth × intensity |
| Compute roof | Performance ≤ peak FLOPs (dtype / Tensor Core dependent) |
| Ridge point | peak FLOPs / peak HBM BW — left = mem-bound, right = compute-bound |
| Prefill (L21/L22) | Often compute-bound (fat prompt GEMMs) → watch SM util + power |
| Decode | Often HBM / KV-bound → watch mem BW util + KV seats, not SM vanity |
| Cell capacity | min(FLOPs headroom, HBM BW headroom, NVLink/RDMA headroom, KV seats) |
H100/H200-class talking numbers (order-of-magnitude for interviews — always cite your SKU datasheet): HBM roofs land in the ~3 TB/s class; dense Tensor FLOPs are far higher → ridge sits at high intensity. Decode traffic lives left of the ridge; big prefill batches push right. Use DCGM SM vs memory util plus load-test points to see where the job sits — then size pools accordingly.
7. Stitching the observability stack
| Layer | Signal | Action |
|---|---|---|
| Silicon (DCGM) | XID, ECC, throttle, NVLink errors | Cordon / RMA / cooling |
| Fabric (NCCL canaries) | BusBw regress, init hangs | Quarantine NIC/rail; fix NCCL_IB_HCA |
| App SLOs (L21) | TTFT / TPOT / goodput burn | Scale pool; shed load |
| PD / MoE (L22) | KV transfer latency, expert imbalance | Placement / EP rebalance |
| Capacity | Roofline + KV seats + fabric | Admit / cell plan / HPA ceilings |
8. Profiling metrics cost & MIG exporter idiosyncrasies
| Gotcha | Operator note |
|---|---|
| Profiling fields (SM occupancy, Tensor util, NVLink bandwidth histograms) | On Ampere-and-earlier, some need proprietary DCGM packages / higher collection cost — sample slower in huge fleets |
| Collection interval | 1s looks great in demos; 10–30s is often the fleet default; page latency ≠ scrape latency |
| Embedded vs remote host-engine | DGX-class images may already run nv-hostengine — point exporter at it to avoid dual engines fighting |
| MIG metrics | Exporter publishes full GPU + MIG instances; alerts must key on MIG UUID or you cordon the wrong blast radius |
| Device plugin unhealthy | GPU Operator / device plugin may taint before your Prometheus rule fires — trust both; don’t race uncordon |
| Clock throttle reasons | Bitfield: thermal vs power vs app clocks — misreading it sends the wrong on-call (facilities vs platform) |
9. Capacity planning loop (weekly cell review)
- Pull p95 SM util, HBM util, power, NVLink/IB BW, KV seat util, TTFT/TPOT burn by pool.
- Place representative prefill and decode load tests on the roofline (intensity × achieved FLOPs/BW).
- Compute headroom: FLOPs, HBM, fabric, KV seats — take the min.
- Decide: scale pool, move PD ratio (L22), rebalance MoE EP, or open a new cell (fleet vocabulary from L1 — full multi-cluster routing in Lesson 24).
- Gate: no cell expansion without green NCCL canary baseline for that SKU×topology.
10. Interview trap — “utilization” vanity
An idle-looking decode GPU at 15% SM with 95% HBM is often healthy and full. A prefill GPU at 95% SM with rising TTFT queue may still need more prefill replicas, not “optimize the kernel.” Platform interviews punish SM-only dashboards; reward bound-aware reading of DCGM + SLOs together.
Concrete commands & config
Host / node: nvidia-smi + dcgmi
# Snapshot (human)
nvidia-smi -q -d UTILIZATION,MEMORY,POWER,CLOCK,TEMPERATURE,ECC,PAGE_RETIREMENT
nvidia-smi -L   # UUID list — prefer UUID over index in runbooks

# DCGM discovery / health (on node with dcgmi)
dcgmi discovery -l
dcgmi health --set max
dcgmi health --check
dcgmi diag -r 1          # short diagnostic rung; escalate rungs carefully in prod
dcgmi groups --list

# Watch XIDs in kernel log (correlate with DCGM_FI_DEV_XID_ERRORS)
dmesg -T | rg -i 'xid|nvrm|nvidia'
journalctl -k -g 'Xid' --since '1 hour ago'
dcgm-exporter quick check
# GPU Operator / Helm usually runs this as a DaemonSet
kubectl -n gpu-operator get pods -l app=nvidia-dcgm-exporter -o wide
kubectl -n gpu-operator port-forward ds/nvidia-dcgm-exporter 9400:9400
curl -s localhost:9400/metrics | rg 'DCGM_FI_DEV_(GPU_UTIL|FB_USED|POWER_USAGE|XID|NVLINK)'

# Confirm Kubernetes pod mapping labels if enabled
curl -s localhost:9400/metrics | rg 'pod=|namespace=|UUID='
Helm / values sketch (dcgm-exporter)
# Shape only — pin digests in real values; prefer GPU Operator when it already owns the stack
dcgmExporter:
  enabled: true
  repository: nvcr.io/nvidia/k8s/dcgm-exporter
  version: "4.1.1-4.4.1-ubuntu22.04"   # example pin — replace with current signed digest
  service:
    enable: true
    port: 9400
  env:
    - name: DCGM_EXPORTER_KUBERNETES
      value: "true"
    - name: DCGM_EXPORTER_INTERVAL
      value: "10000"   # ms; balance freshness vs cost
  # Prefer RuntimeClass + PSS; avoid blanket privileged when GPU Operator patterns allow
  securityContext:
    allowPrivilegeEscalation: false
    readOnlyRootFilesystem: true
    capabilities:
      drop: ["ALL"]
      # SYS_ADMIN historically required for some DCGM paths — gate via RuntimeClass + admission
  resources:
    requests:
      cpu: 100m
      memory: 128Mi
ServiceMonitor + PrometheusRule sketches
apiVersion: monitoring.coreos.com/v1
kind: ServiceMonitor
metadata:
  name: dcgm-exporter
  namespace: gpu-operator
  labels:
    release: kube-prometheus
spec:
  selector:
    matchLabels:
      app: nvidia-dcgm-exporter
  namespaceSelector:
    matchNames: ["gpu-operator"]
  endpoints:
    - port: metrics
      interval: 15s
      honorLabels: true
      relabelings:
        # Keep joins lean — drop high-cardinality pod labels if cardinality burns
        - action: labeldrop
          regex: "(container|endpoint|service)"
---
apiVersion: monitoring.coreos.com/v1
kind: PrometheusRule
metadata:
  name: gpu-dcgm-health
  namespace: gpu-operator
spec:
  groups:
    - name: dcgm-health
      rules:
        - alert: GpuXidErrors
          expr: increase(DCGM_FI_DEV_XID_ERRORS[5m]) > 0
          for: 0m
          labels:
            severity: page
          annotations:
            summary: "GPU XID on {{ $labels.Hostname }} UUID={{ $labels.UUID }}"
            runbook: "cordon node → drain → quarantine UUID → soft-reset vs RMA"
        - alert: GpuThermalThrottle
          expr: DCGM_FI_DEV_CLOCK_THROTTLE_REASONS_HW_THERMAL > 0
          for: 5m
          labels:
            severity: ticket
          annotations:
            summary: "Thermal throttle {{ $labels.Hostname }} {{ $labels.UUID }}"
        - alert: GpuEccDbe
          expr: increase(DCGM_FI_DEV_ECC_DBE_VOL_TOTAL[15m]) > 0
          for: 0m
          labels:
            severity: page
          annotations:
            summary: "DBE ECC {{ $labels.UUID }} — drain / RMA path"
Remediation loop (cordon / drain)
NODE=gpu-node-17
UUID=GPU-xxxxxxxx-xxxx-xxxx-xxxx-xxxxxxxxxxxx

# 1) Cordon immediately on page
kubectl cordon "$NODE"

# 2) Drain inference carefully (respect PD / MoE disruption budgets from L22)
kubectl drain "$NODE" --ignore-daemonsets --delete-emptydir-data \
  --grace-period=120 --timeout=15m

# 3) Quarantine label for scheduler / device plugin policy
kubectl label node "$NODE" gpu.quarantine/uuid="$UUID" gpu.quarantine/reason=xid --overwrite

# 4) Ticket: soft reset once if policy allows; else host RMA
# 5) After return-to-service: NCCL canary MUST pass before uncordon for train/serve
NCCL canary — all_reduce_perf
# Single-node NVLink island (8 GPUs)
mpirun -np 8 ./build/all_reduce_perf -b 8 -e 8G -f 2 -g 1

# Multi-node RDMA (example: 4 nodes × 8 GPUs)
mpirun -np 32 -N 8 \
  -x NCCL_DEBUG=INFO \
  -x NCCL_DEBUG_SUBSYS=INIT,NET,GRAPH \
  -x NCCL_IB_HCA=mlx5_bond_0 \
  -x NCCL_NET_GDR_LEVEL=PHB \
  ./build/all_reduce_perf -b 8 -e 8G -f 2 -g 1

# Interpreting output (see NVIDIA/nccl-tests PERFORMANCE.md):
#   out-of-place/in-place time(us)  algbw(GB/s)  busbw(GB/s)
# Compare **busbw** to topology baseline (NVLink vs IB peak × efficiency).
# AlgBw is what the collective “looks like”; BusBw is hardware-comparable.
# Canary Job sketch — privilege floor, no weights, no train SA
apiVersion: batch/v1
kind: Job
metadata:
name: nccl-canary-rail-a
namespace: gpu-observability
labels:
role: nccl-canary
trust-domain: obs-prod
spec:
backoffLimit: 0
template:
metadata:
labels:
role: nccl-canary
trust-domain: obs-prod
spec:
serviceAccountName: nccl-canary # NOT train-sa / NOT inference WI with PutObject
runtimeClassName: nvidia
restartPolicy: Never
nodeSelector:
pool: fabric-canary
tolerations:
- key: nvidia.com/gpu
operator: Exists
effect: NoSchedule
containers:
- name: all-reduce
image: registry.example.com/nccl-tests@sha256:REPLACE
command: ["/bin/bash", "-lc"]
args:
- |
set -euo pipefail
export NCCL_DEBUG=WARN
export NCCL_IB_HCA=mlx5_bond_0
./build/all_reduce_perf -b 8 -e 4G -f 2 -g 1 | tee /reports/out.txt
resources:
limits:
nvidia.com/gpu: 8
securityContext:
allowPrivilegeEscalation: false
readOnlyRootFilesystem: true
capabilities:
drop: ["ALL"]
volumeMounts:
- name: reports
mountPath: /reports
# Explicitly NO /models weight mounts
volumes:
- name: reports
emptyDir: {}NetPol + Kyverno/VAP sketches for obs privilege floor
apiVersion: networking.k8s.io/v1
kind: NetworkPolicy
metadata:
  name: dcgm-scrape-allow
  namespace: gpu-operator
spec:
  podSelector:
    matchLabels:
      app: nvidia-dcgm-exporter
  policyTypes: ["Ingress", "Egress"]
  ingress:
    - from:
        - namespaceSelector:
            matchLabels:
              role: metrics
          podSelector:
            matchLabels:
              app: prometheus
      ports:
        - protocol: TCP
          port: 9400
  egress:
    - to:
        - namespaceSelector:
            matchLabels:
              role: dns
# No path to model-inference weight buckets or train namespaces
---
apiVersion: admissionregistration.k8s.io/v1
kind: ValidatingAdmissionPolicy
metadata:
  name: obs-privilege-floor
spec:
  failurePolicy: Fail
  matchConstraints:
    resourceRules:
      - apiGroups: ["apps", "batch"]
        apiVersions: ["v1"]
        operations: ["CREATE", "UPDATE"]
        resources: ["daemonsets", "jobs", "deployments"]
  validations:
    - expression: >
        !has(object.metadata.labels) ||
        object.metadata.labels["trust-domain"] != "obs-prod" ||
        (
          object.spec.template.spec.serviceAccountName in
            ["dcgm-exporter", "nccl-canary", "gpu-metrics-reader"] &&
          !object.spec.template.spec.serviceAccountName.startsWith("train")
        )
      message: "obs-prod workloads must use obs SAs — never train SA"
Roofline / capacity quick math (runbook scratch)
# Order-of-magnitude cell headroom (replace with SKU datasheet numbers)
# peak_flops_tf = 989      # example H100 SXM BF16 dense-ish talking point — verify your SKU
# hbm_tib_s     = 3.35
# ridge         = peak_flops_tf / hbm_tib_s   # FLOPs/byte scale after unit normalize
#
# From DCGM during load test:
#   sm_util, mem_util, power, nvlink_bw, nic_bw
# Prefill pool: expect high SM + high power; if SM low + TTFT bad → placement / batching
# Decode pool: expect high mem util; if SM high + TPOT bad → contention / wrong co-location (L22)
#
# Cell admit ceiling:
#   capacity = min(flops_headroom, hbm_headroom, fabric_headroom, kv_seats_free)
Failures & fixes
| Symptom | Likely cause | Fix / mitigation |
|---|---|---|
| Silent TPOT regression; GPUs “look fine” in smi once/day | No continuous DCGM scrape / wrong field group | Deploy dcgm-exporter; alert on throttle + mem util; join UUID |
| Pages on random nodes nightly | XID / ECC without remediation loop | Cordon+drain automation; quarantine UUID; RMA policy |
| Same UUID flaps after reboot | HW fault treated as soft | Stop soft-reset loops; RMA / host replace |
| MIG workload dies; sibling MIGs OK | Partition-level fault | Quarantine MIG UUID; don’t drain whole node blindly (L18) |
| NCCL init hang after NIC maintenance | Wrong NCCL_IB_HCA / GDR path | Canary on reclaim; pin HCA; topology check (L19) |
| BusBw 40% of baseline; AlgBw “ok-ish” | Fabric congestion / PFC / miswired rail | Compare BusBw; quarantine rail; don’t trust AlgBw alone |
| Prefill pool “underutilized” SM but TTFT burns | Waiting on KV transfer / router (L22) | Stitch PD metrics; don’t only scale on SM util |
| Decode SM low, TPOT burns | Expected mem-BW bound — or KV exhaustion | Check HBM/KV seats (L21); roofline placement |
| Prometheus OOM / huge bills | High-cardinality pod/tenant labels on DCGM | Labeldrop; hash digests; no user IDs in metrics |
| Metrics open to whole cluster | Missing NetPol on :9400 | Scrape-path NetPol; optional mTLS mesh (L9, L10) |
| Canary Job mounts prod weights | Copied serve pod template | No weight mounts; canary SA only; admission floor |
Obs DaemonSet uses train-sa | Convenience anti-pattern | Separate dcgm-exporter / nccl-canary SAs; VAP deny train SA |
Unsigned dcgm-exporter :latest | Supply-chain gap | Digest pin + cosign (L12) |
| Long-term metrics in public bucket | “Debug dump” without IAM | CMEK + private bucket + GetObject least privilege (L13) |
Security & hardening
Observability agents sit beside the most valuable workloads you have. A world-readable :9400, a privileged NCCL “just for tonight” DaemonSet, or a train SA on an exporter turns telemetry into a tenant map, model-inventory leak, and privilege trampoline. Treat DCGM and canaries as production trust domains — same spirit as L11–L14.
| Control | Why | Practice |
|---|---|---|
| Who scrapes DCGM | Metrics reveal util, SKU, sometimes pod/model labels | NetPol: only Prometheus / metrics ns → :9400; deny train & app namespaces |
| Label hygiene (PII / model IDs) | Cardinality + privacy + competitive intel | No user IDs, prompt hashes, or raw model names; use pool + short digest + UUID |
| Tenant labels | Multi-tenant cells leak occupancy patterns | Aggregate; gate detailed joins behind ACLed systems, not public Grafana |
| NCCL test privilege | Needs GPUs / IB — easy to over-privilege | Dedicated SA; drop caps; no hostPath weights; time-bounded Jobs; RuntimeClass |
| RuntimeClass + admission | Diagnostic DaemonSets love privileged: true | PSS restricted baseline; VAP/Kyverno privilege floor for trust-domain=obs-prod |
| Signed nvidia/dcgm images | Exporter is on every GPU node | Private mirror; cosign verify; digest pin; SBOM (L12) |
| RBAC for exporters | K8s mode may need pod list/watch | Minimal Role; no secrets get; no exec into serve pods |
| No train SA on obs pods | Train WI often has PutObject / broad storage | dcgm-exporter, nccl-canary, gpu-metrics-reader only |
| RO weights still apply | Obs sidecars next to serve must not widen write path | If any agent shares a node with serve: still no writable weight mounts; serve SAs stay GetObject-only (L13) |
| Bucket IAM for metric archives | Long-term Prom remote-write / debug dumps | Private bucket; CMEK; least-privilege writers; no public ACLs |
| NetPol on scrape + canary | Lateral movement via “monitoring” | Default-deny in gpu-operator / gpu-observability; allow DNS + scrape + canary fabric CIDR only (L9) |
| Secrets | Grafana admin, remote-write tokens | External Secrets / CSI; rotate; never bake into exporter images |
AI/ML weight, model & deployment hardening beside observability (required)
Observability does not relax the weight/deploy floor from L13/L14. Prefill/decode/MoE pods still hydrate signed weights on RO mounts with GetObject-only WI. Exporters and NCCL canaries must not gain train PutObject, must not mount /models “for debugging,” and must not share serve SAs. If you scrape pod labels, prefer image digest short-hash over marketing model names. Deployment admission still requires RuntimeClass, digest pins, and pool nodeSelectors — including for diagnostic DaemonSets that “only read metrics.”
| Scenario | Weight / model / deploy controls |
|---|---|
| dcgm-exporter roll | Signed digest; no volume mounts to weight PVCs; obs SA only |
| NCCL canary on serve rails | No weight mounts; fabric CIDR only; results to private report bucket |
| Grafana dashboard share | Strip tenant / model labels; ACLed folders; no public anonymous org |
| Incident: suspected metric exfil | Revoke scrape NetPol; rotate remote-write creds; audit label configs |
| Obs agent on same node as serve | PSS + RuntimeClass unchanged; RO weights on serve; obs cannot write checkpoints |
| Model swap canary | App SLO + DCGM + NCCL baselines before declaring the cell healthy |
# Sketch: observability-path security floor (platform CR shape)
apiVersion: policy.platform/v1
kind: GpuObsGate
metadata:
  name: dcgm-nccl-floor
spec:
  match:
    labels:
      trust-domain: obs-prod
  require:
    imageDigestPin: true
    cosignVerify: true
    runtimeClass: nvidia
    allowedServiceAccounts: ["dcgm-exporter", "nccl-canary", "gpu-metrics-reader"]
    trainSaOnObsPods: false
    weightMountAllowed: false
    metricLabelAllowlist: ["Hostname", "UUID", "device", "pool", "model_digest_short"]
    metricLabelDenylist: ["user_id", "tenant_email", "prompt_hash", "raw_model_name"]
    networkPolicy:
      defaultDeny: true
      allowScrapeFrom: ["namespace:metrics"]
      allowCanaryFabricCidr: "10.50.0.0/16"
    metricsArchive:
      publicAccess: false
      cmek: true
      putObjectSa: "metrics-archiver"   # not train-sa
Punchline: DCGM and NCCL canaries are production control-plane adjacent. Scrape NetPol, label allowlists, signed digests, obs-only SAs, no weight mounts on diagnostics, and CMEK private metric archives are what stop “better GPU graphs” from becoming a fleet-wide inventory and privilege leak.
Interview soundbites
- “nvidia-smi is a flashlight; DCGM + Prometheus is the smoke detector.”
- “Join on GPU UUID / MIG UUID — indices lie across reboots.”
- “XID page → cordon → drain → quarantine UUID; soft reset ≠ RMA.”
- “NCCL BusBw is the hardware story; AlgBw is the app story — baseline both per topology.”
- “Canaries on join, after NIC flap, and nightly — not once at cluster birth.”
- “Prefill sits toward the compute roof; decode toward the HBM roof — don’t size both on SM util.”
- “Cell capacity = min(FLOPs, HBM BW, fabric, KV seats) — the minimum wins.”
- “Stitch silicon + fabric + TTFT/TPOT + PD transfer — one burn-rate narrative.”
- “:9400 is sensitive; NetPol the scrape path and ban PII labels.”
- “No train SA on obs or canary pods; no weight mounts on diagnostics.”
- “Next: multi-cluster inference routing and capacity planning across cells.”
How this maps to the JD
Hyperscale + AI/ML platform JDs that mention GPU fleets, inference SLOs, and NCCL/RDMA are asking whether you can operate observability that drives remediation and capacity, not dashboards for their own sake: DCGM field literacy, XID playbooks, NCCL canaries tied to topology, roofline-informed pool sizing, and a security floor on scrape/diagnostic paths. This lesson closes the AI/ML arc from L18–L22 with L9/L11–L14 controls. Fuel: wafer-ai/gpu-perf-engineering-resources (opens in a new tab). Next up — Lesson 24: multi-cluster inference routing & capacity planning across cells.
Watch (talks & demos)
Real talks — watch after Failures & fixes.
Install NVIDIA DCGM with Prometheus and Grafana in Kubernetes
Hands-on path from GPU Operator / Helm dcgm-exporter to Prometheus scrape on :9400 and Grafana. Operator takeaway: exporter is a DaemonSet trust domain; wire ServiceMonitor early; treat metrics as production dependencies next to Triton/vLLM-class serve.
Open on YouTube (opens in a new tab)
GPU MODE Lecture 17 — NCCL
Collectives mental model that makes all_reduce_perf canaries make sense: what all-reduce is doing on the wire, why multi-GPU / multi-node paths differ, and how that ties to topology. Operator takeaway: canaries validate the fabric story from L19, not just “NCCL works on my laptop.”
Open on YouTube (opens in a new tab)
GPU MODE Lecture 8 — CUDA Performance Checklist (roofline)
Arithmetic intensity, memory vs compute bound, and the checklist mindset behind roofline capacity planning. Operator takeaway: you are not writing kernels here — you are placing prefill vs decode on the roof and refusing to size decode pools by SM vanity metrics.
Open on YouTube (opens in a new tab)
References
- NVIDIA DCGM docs (opens in a new tab) · Feature overview (health / diag) (opens in a new tab)
- dcgm-exporter (opens in a new tab) · GPU telemetry guide (opens in a new tab) · Monitoring GPUs in Kubernetes with DCGM (opens in a new tab)
- NVIDIA/nccl-tests (opens in a new tab) · PERFORMANCE.md (BusBw vs AlgBw) (opens in a new tab) · NCCL tuning blog (opens in a new tab)
- Roofline model (Williams et al.) (opens in a new tab) · Nsight Compute roofline demo (opens in a new tab) · GPU MODE lectures (opens in a new tab)
- wafer-ai/gpu-perf-engineering-resources (opens in a new tab) — start-here roofline + inference arithmetic fuel
- Prior: 22 — Prefill/decode disagg / MoE · 21 — Inference serving SLOs · 20 — Scheduling · 19 — GPU topology · 18 — GPU node pools · 14 — ML deploy hardening · 13 — ML weights · 12 — Supply chain · 11 — Cluster security · 09 — NetworkPolicy
- Next: Lesson 24 — multi-cluster inference routing & capacity planning across cells
Quick self-check
Out loud, in under two minutes:
- What does dcgm-exporter give you that nvidia-smi does not — and which join keys matter?
- Walk an XID page from alert → cordon → drain → soft reset vs RMA.
- When do you run NCCL canaries, and how do you interpret BusBw vs AlgBw against an L19 baseline?
- Place prefill vs decode on a roofline and define cell capacity as a minimum of four resources.
- How do you stitch DCGM + NCCL + TTFT/TPOT + PD/MoE metrics into one operator narrative?
- List four security controls for obs paths — scrape NetPol, label hygiene, no train SA, signed digests / no weight mounts on canaries.