Lesson 2 — Kubernetes control plane internals at scale
2026-09-09 · refreshed 2026-09-10
What interviewers are really probing
At hyperscale they do not want a textbook list of kube-apiserver / etcd / scheduler. They want to know whether you understand where latency and failure concentrate, how watches and LISTs become denial-of-service, why admission webhooks tax every write, and why each cell owns its own control plane.
I have chased “mysterious” scheduler backlog that was actually etcd fsync latency from a noisy neighbor on the control-plane disks, and “RBAC outage” that was a stuck validating webhook with fail-closed. Those stories are what separate operators from cert-memorizers.
| Component | Job | What breaks at scale |
|---|---|---|
| kube-apiserver | Front door: authn/authz, admission, aggregation, watch fan-out | Watch storms, webhook timeouts, LIST of huge collections, APF saturation |
| etcd | Strongly consistent store (Raft) | Size growth, slow fsync, quorum loss, compaction debt, NOSPACE |
| kube-controller-manager | Reconciliation loops (Deployments, Endpoints, …) | Stampeding requeues, leader election flaps, deep workqueues |
| kube-scheduler | Bind pods → nodes | Queue depth, plugin latency, unschedulable backlog, preemption storms |
| cloud-controller-manager | Cloud LB/routes/nodes | Cloud API rate limits, stale node objects, partial route programming |
Core diagram: control plane under pressure
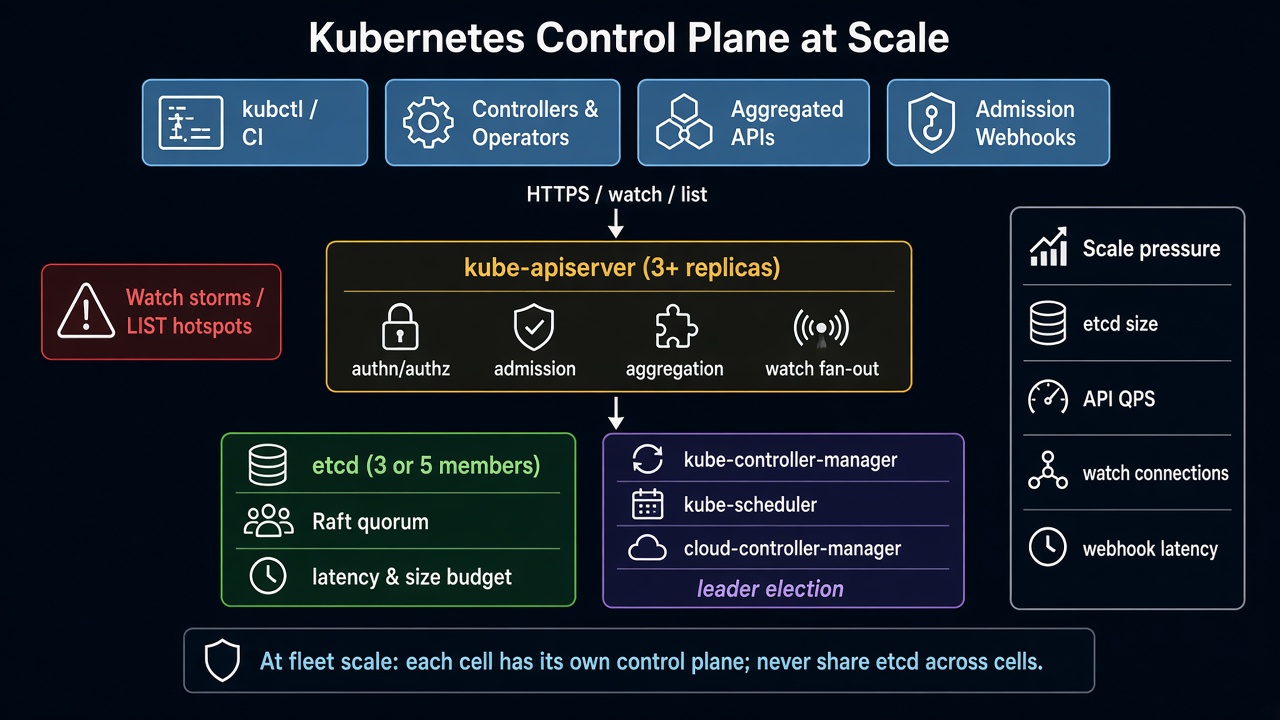
Read it top-down: clients and operators hammer the API server; HA apiservers share one etcd quorum; controllers/scheduler leader-elect. The right rail is your scale budget — etcd size, API QPS, watch count, webhook p99.
The request path (know this cold)
Interview trap: people say “everything goes to etcd.” Reads at steady state are mostly served from the apiserver watch cache. etcd is the source of truth and the write bottleneck; watch fan-out is the read-scale amplifier. A LIST without resourceVersion (or with resourceVersion=0 semantics that force etcd) is how you DDoS yourself.
etcd: the hard ceiling
| Budget | Typical target (per cell) | Why it matters |
|---|---|---|
| DB size | Keep well under ~8 GB practical; alarm earlier (e.g. 2–4 GB) | Compaction + defrag cost; restore time = RTO |
| Latency | p99 apply / commit in low ms | Scheduler & controllers stall when etcd slows |
| Members | 3 (common) or 5 (stricter quorum) | Never even count; never share across cells |
| Objects | Prefer many small objects carefully; avoid giant Secrets/ConfigMaps | One huge object = expensive revisions & bandwidth |
| Snapshots | Automated, tested restore, off-box | Untested backup is fiction |
# Operator muscle memory — etcd health & size (self-hosted; managed K8s: vendor metrics)
export ETCDCTL_API=3
etcdctl --endpoints="$ENDPOINTS" endpoint health --cluster
etcdctl --endpoints="$ENDPOINTS" endpoint status -w table
etcdctl --endpoints="$ENDPOINTS" alarm list
etcdctl --endpoints="$ENDPOINTS" check perf   # only on idle/staging — can be invasive

# Compaction / defrag (understand before running in prod — follow your runbook)
# etcdctl compact <rev>
# etcdctl defrag --cluster

# Apiserver / flow control signals
kubectl get --raw='/readyz?verbose'
kubectl get --raw='/livez?verbose'
kubectl get flowschemas,prioritylevelconfigurations
kubectl get --raw='/metrics' | grep -E 'apiserver_request|etcd_request|apiserver_flowcontrol'

# Who is watching / listing hard? (metrics + audit)
# Look at: apiserver_current_watchers, apiserver_request_duration_seconds{verb="LIST|WATCH"}
kubectl top pods -n kube-system   # crude; prefer Prometheus on apiserver/etcd
Fleet rule from Lesson 1, restated in control-plane terms: one etcd quorum per cell. Sharing etcd across “clusters” couples blast radius and upgrade freezes.
Watches, LISTs, and how you DDoS yourself
# Bad: every custom controller does a full LIST + resync every 30s on a huge CRD
# Good: shared informers, long-lived watches, bounded workqueues, client-side rate limits
apiVersion: apps/v1
kind: Deployment
metadata:
  name: fleet-operator
spec:
  template:
    spec:
      containers:
      - name: manager
        args:
        - --kube-api-qps=20
        - --kube-api-burst=40
        # Prefer informers over raw LIST loops; tune resyncPeriod high (hours, not seconds)
        # Enable client-go prioritization / APF-aware behavior where available
# Admission webhook: treat p99 like apiserver SLO
apiVersion: admissionregistration.k8s.io/v1
kind: ValidatingWebhookConfiguration
metadata:
name: policy-guard
webhooks:
- name: guard.example.com
failurePolicy: Fail # or Ignore — explicit product decision, document it
timeoutSeconds: 3 # never leave default 10s hanging over every write
sideEffects: None
admissionReviewVersions: ["v1"]
clientConfig:
service:
name: policy-guard
namespace: admission
path: /validate
rules:
- apiGroups: [""]
apiVersions: ["v1"]
operations: ["CREATE", "UPDATE"]
resources: ["pods"]
scope: NamespacedHotspots I’ve hit:
- Watch storms — thousands of clients reconnect after an apiserver bounce → thundering herd; mitigate with APF, staggered reconnects, enough apiserver replicas.
- LIST without cache-friendly resourceVersion — bypasses watch cache; hits etcd hard.
- Admission webhooks — sync path on every create/update; a slow webhook = global latency tax; fail-closed wedges deploys; fail-open can wedge security.
- Aggregated APIs — extra hop; misbehaving extension API can wedge perceived control-plane health.
- Leader election flaps — overloaded control-plane nodes or etcd latency → controllers thrash; looks like “Deployments not rolling.”
- Huge Endpoints / uncapped watches on Secrets — classic etcd size and bandwidth killers; prefer EndpointSlices; don’t mount giant config blobs.
HA shape you should draw on a whiteboard
Horizontal scale: more apiservers. Vertical / careful scale: etcd. Controllers: usually one active leader, not “run 50 active managers.” Put etcd on dedicated disks (low latency SSD/NVMe); never share noisy disks with app workloads.
Idiosyncrasies at scale
- APF (API Priority and Fairness) is not optional once you have many operators/controllers. Without it, a debug
kubectl get pods -Afrom a CI job can starve controllers. --max-requests-inflight/--max-mutating-requests-inflightare blunt instruments; prefer APF queues with named PriorityLevels for system vs workload vs admin.- Watch cache can serve slightly stale reads. Controllers that need linearizable reads must ask for them explicitly — know when “eventual” is wrong (e.g. some security decisions).
- Managed control planes hide etcd, not the symptoms. On GKE/EKS/AKS you still watch apiserver latency, webhook errors, and object counts — you just open a vendor ticket instead of SSH to etcd.
- CRDs are forever until you migrate. Conversion webhooks + large CustomResources amplify apiserver CPU; version and prune aggressively.
- Scheduler plugins add latency. Custom plugins that call external APIs on every pod = death. Keep filter/score pure and fast.
Failures & fixes
| Symptom | Likely root cause | Fix / mitigation |
|---|---|---|
| Apiserver p99 spike after onboarding ~40 operators / new controllers | Watch count explosion; LIST storms; APF default queue saturated | Inspect watch metrics & audit verb=LIST; enforce client QPS; shared informers; tune FlowSchemas; add apiserver replicas |
Deploys hang; kubectl apply times out; pods not created | Validating/mutating webhook down or slow; failurePolicy: Fail | Check webhook Endpoints/pods; raise timeout carefully or break-glass Ignore with audit; page webhook owners; never leave timeout at 10s casually |
| Scheduler backlog; pending pods climb; CPU fine on workers | etcd commit latency / control-plane disk; or scheduler plugin latency | etcd endpoint status, disk iowait; move etcd to dedicated volumes; profile scheduler plugins; check unschedulable reasons |
| Controllers “randomly” stop reconciling for minutes | Leader election loss from apiserver/etcd blips | Stabilize etcd; tune lease durations carefully; ensure only one active CCM/KCM; alert on leader changes |
etcd NOSPACE / DB > alarm threshold | Compaction not running; giant objects; event spam | Compact + defrag per runbook; find large keys; fix Event floods; restore from snapshot if corrupted; raise alarms earlier next time |
API Priority queues show rejected climbing for workload-low | CI / scrapers competing with system | Separate PriorityLevels; protect kube-system & leaders; rate-limit CI kubeconfigs; educate teams off -A LISTs |
| Post-upgrade: watch reconnect stampede, brief outage | Rolling apiserver without enough capacity for reconnect | Surge apiserver replicas before bounce; staggered shutdown; verify APF; soak canary cell first (Lesson 1 wave) |
| Cloud Node objects stale; routes missing | cloud-controller-manager rate-limited or wrong credentials | CCM logs; cloud API quotas; verify instance tags/VPC; don’t run two CCMs active |
Security & hardening
The apiserver is the policy chokepoint for the cell: authn, authz, admission, and audit all sit on the request path. Hardening here beats bolting scanners on after the fact.
| Control | Operator practice |
|---|---|
| RBAC + Node authorizer | Least privilege for humans, CI, and kubelets; Node authorizer limits what a node can read |
| Admission as policy gate | PSS / Kyverno / OPA Gatekeeper / ValidatingAdmissionPolicy — fail-closed for security, with break-glass |
| Audit logs | Ship audit to immutable storage; alert on get secrets, anonymous, and privilege escalations |
| etcd encryption at rest | Encrypt Secrets (and prefer external KMS); lock down etcd peers to control-plane only |
| Break-glass | Documented local-cert admin path; time-boxed, audited, never the daily driver |
| Webhook supply chain | Pin webhook images; least-privilege SA; mTLS to webhook; treat slow/unknown webhooks as risk |
# Sketch: encryption-at-rest for Secrets (apiserver --encryption-provider-config)
apiVersion: apiserver.config.k8s.io/v1
kind: EncryptionConfiguration
resources:
  - resources: ["secrets"]
    providers:
      - aescbc:
          keys:
            - name: key1
              secret: <base64-32-byte-key>
      - identity: {}
AI/ML fleets: admission must gate unsigned model/runtime images and deny world-readable Secret mounts for weight pullers. Audit who can create Jobs that mount checkpoint volumes; a malicious training Job with cluster-admin is a weight-exfiltration path.
Interview soundbites (steal these)
- “Apiserver is horizontally scalable; etcd is the consistency bottleneck.” I size cells so etcd stays boring.
- “Most reads are watch-cache hits; LIST-to-etcd is a smell.” Operators must use informers and rate limits.
- “Admission webhooks sit on the synchronous path.” I treat webhook p99 like apiserver SLO — fail-open vs fail-closed is a product decision with a break-glass runbook.
- “Control-plane outage is a blast-radius event.” That’s why we run many cells instead of one heroic cluster (Lesson 1).
- “APF is the seatbelt.” At fleet scale, unprotected apiservers get taken down by friendly fire from CI and custom controllers.
How this maps to the JD
| JD theme | Control-plane angle |
|---|---|
| 100+ clusters / 10K+ nodes | Many independent control planes; fleet ops outside etcd |
| Cluster provisioning | Bootstrapping HA apiserver+etcd+CCM correctly |
| Borg/Mesos-like | Borgmaster ≈ control plane; cell ≈ Borg cell |
| Cilium / networking | Relies on watches of Pods/Services/EndpointSlices |
| Security | Authn/authz + admission is the policy chokepoint |
| Terraform / Temporal / Argo | Change the control plane via pipelines, not SSH |
Watch (talks & demos)
Real-world talks and demos that map to this lesson — watch after the Failures & fixes table.
Setting up Etcd with Kubernetes for Thousands of Nodes — KubeCon EU 2023
Datadog + Isovalent on etcd architecture, disk/network bottlenecks, LIST storms, and API Priority and Fairness at large node counts.
Open on YouTube (opens in a new tab)
Secrets of Running Etcd — Marek Siarkowicz, Google (KubeCon NA 2023)
Production etcd reliability: compaction, quotas, performance myths, and what actually breaks at scale.
Open on YouTube (opens in a new tab)
Defusing the Kubernetes API Performance Minefield — KubeCon
Watch-cache, LIST without resourceVersion, and how bad controllers DDoS your apiserver.
Open on YouTube (opens in a new tab)
References
- Kubernetes components (opens in a new tab) — official control-plane map
- etcd — performance & what to measure (opens in a new tab) — fsync, snapshots, alarms
- API Priority and Fairness (opens in a new tab) — protecting the apiserver under load
- Watch / LIST consistency (SIG API Machinery) (opens in a new tab) — LIST/WATCH semantics
- Kube-apiserver admission webhooks (opens in a new tab) — sync path & failurePolicy
- Borg paper (opens in a new tab) — cell + master design that inspired this architecture
Quick self-check
If someone asks: “Our apiserver p99 spiked after we onboarded 40 operators — what do you look at first?” — answer watch counts, LIST patterns, webhook latency, APF queues, etcd commit latency, then how you’d shed load (rate limits, shared informers, fail/break-glass the worst webhook, surge apiservers, split the cell). Tie it back to Lesson 1: maybe this cell is too big.
Previous: Lesson 1 — Hyperscale mental model